$500.00
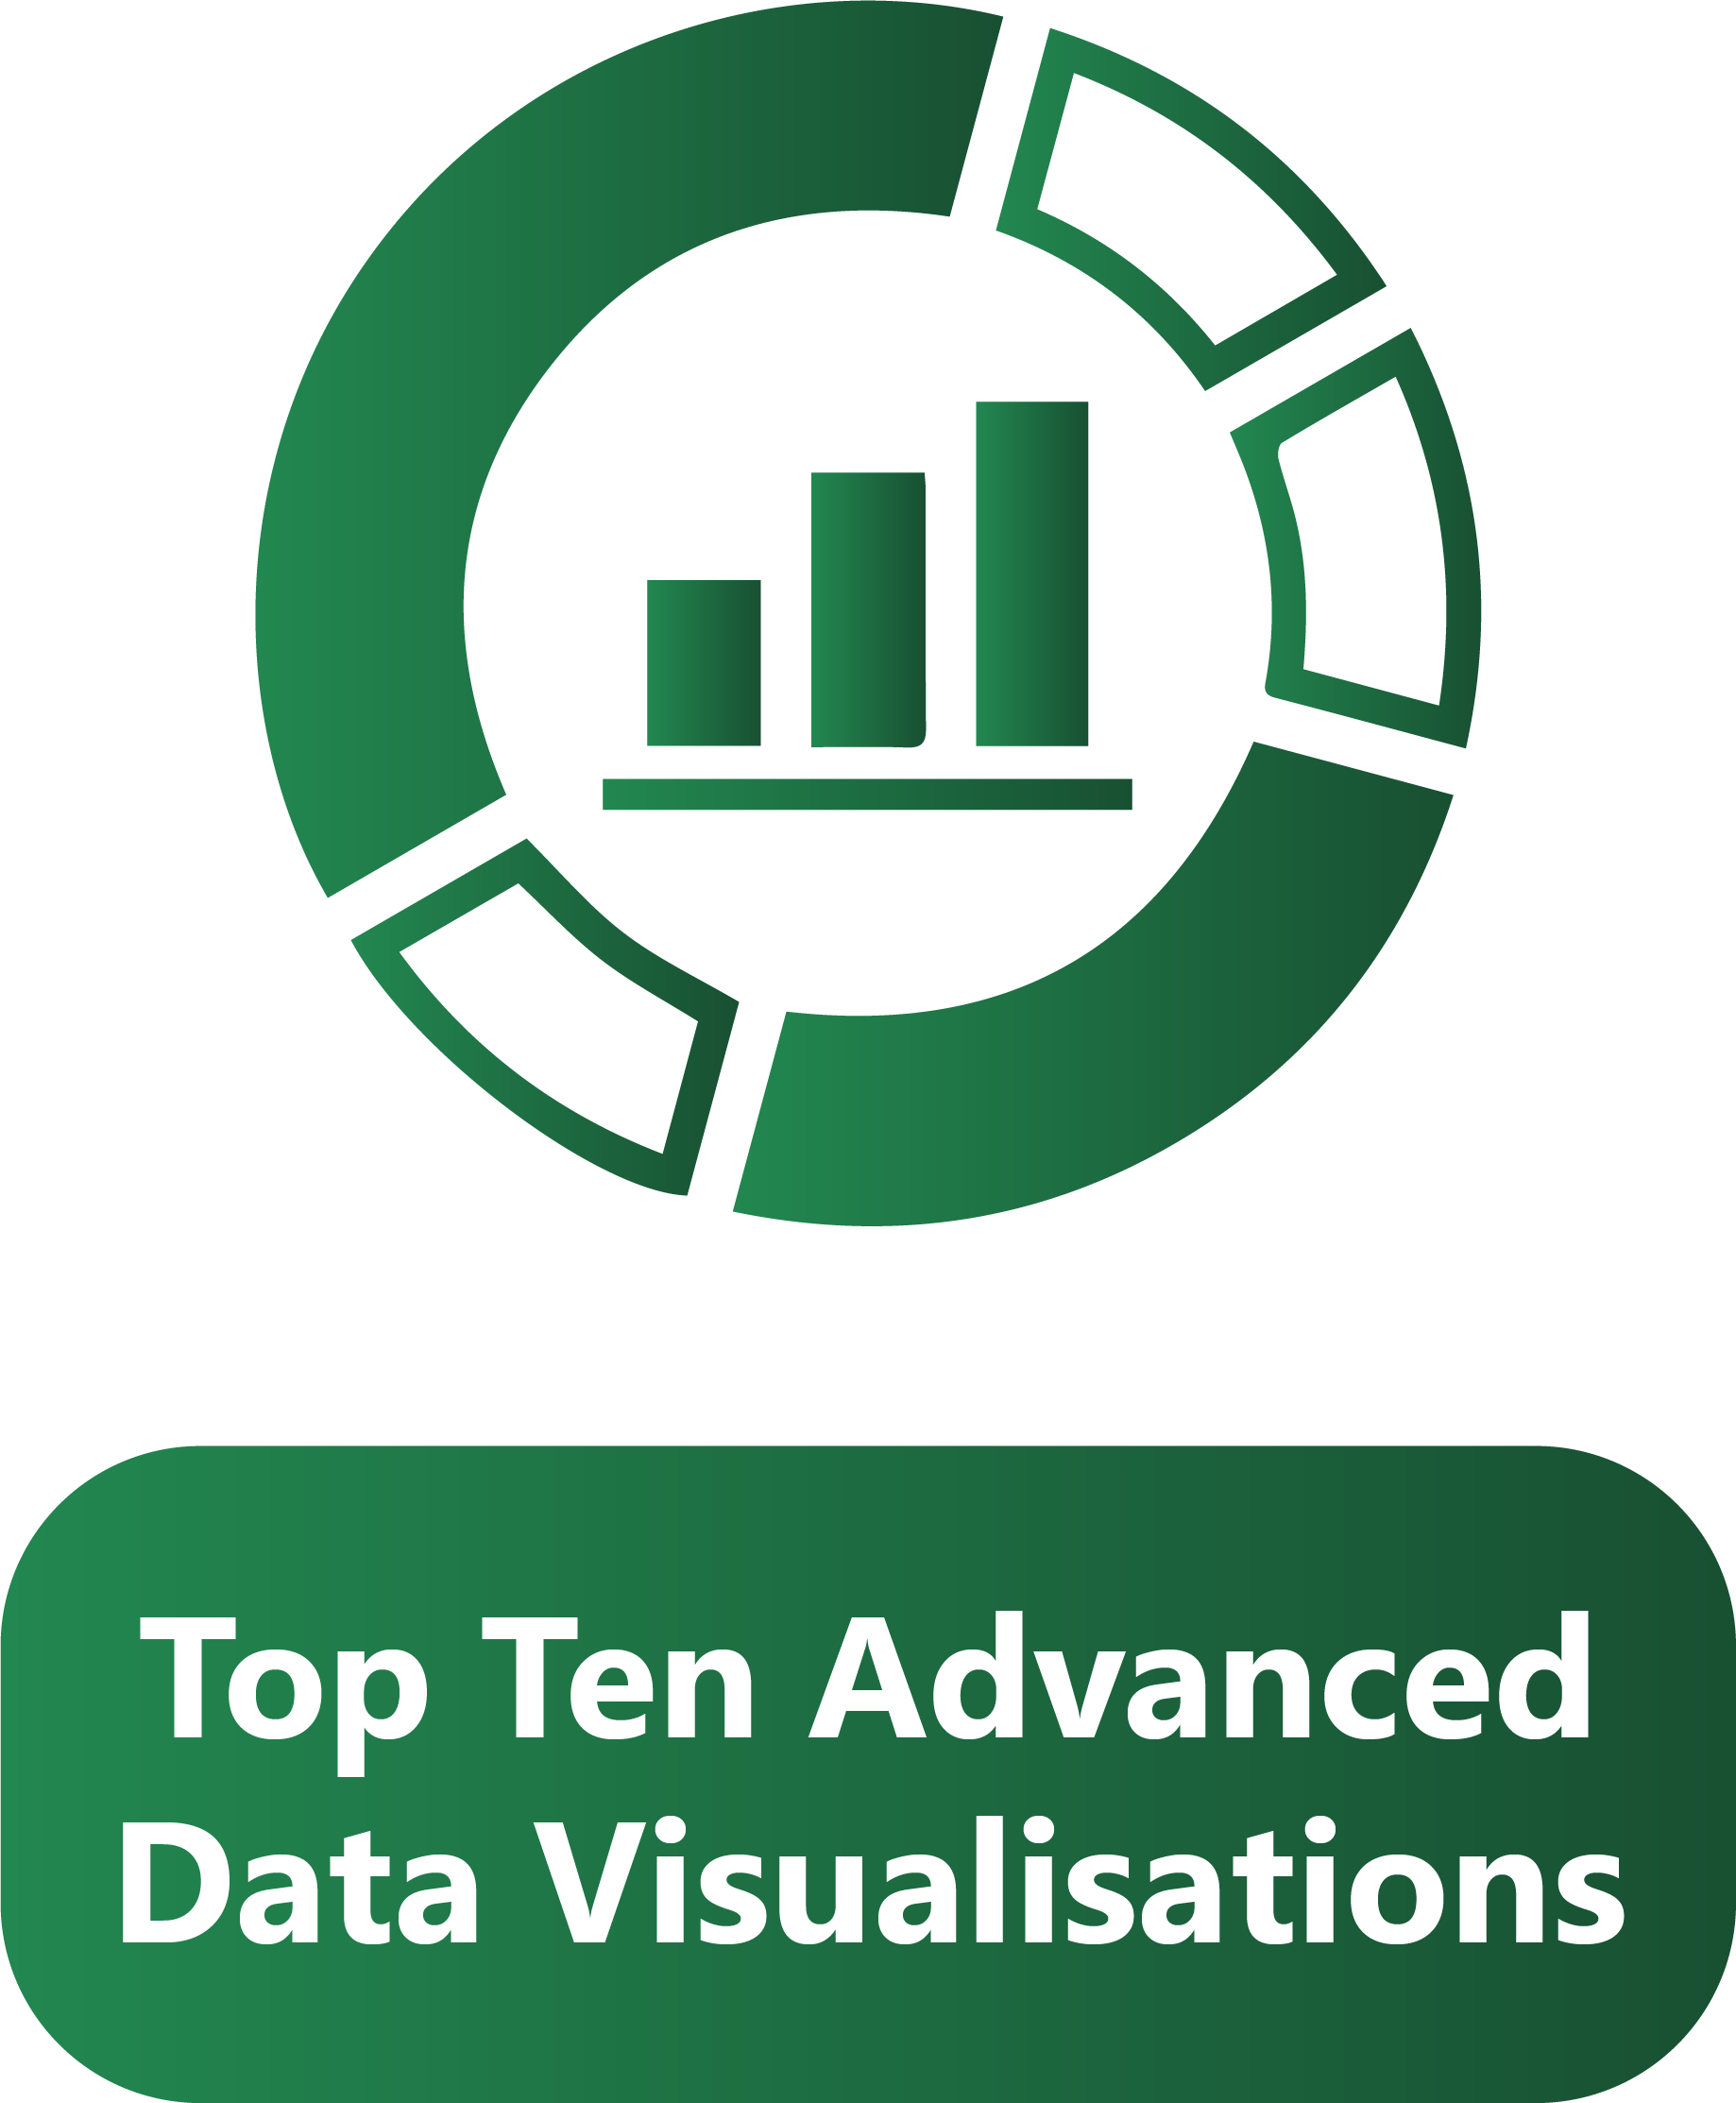
This course is designed to take your charts and graphs use to the next level. In each of the ten sessions students will learn a must know data visualization technique that will elevate the stories they can tell with data.
Description
Sessions Overview:
- Built In Data Visualizations
- Image Overlay Charts & Guage Charts
- Dynamic Series Selection & Array Percentage Grids
- Binary Date Range Charts
- Value Based Formatting Chart
- Animating Changes Over Time
- Dynamic Dashboards
- Scroll & Zoom Charts
- Automatic Updating Chart
- Custom Pacing Charts
Note:
If the number of participants does not reach 10, the money will be returned to you, as we cannot start with fewer participants.
Related products
-
Excel Associate Course
$500.00 – $750.00 Select options This product has multiple variants. The options may be chosen on the product page -

Excel Expert Course
$500.00 – $750.00 Select options This product has multiple variants. The options may be chosen on the product page -

PowerPoint Consulting
$50.00 – $450.00 Select options This product has multiple variants. The options may be chosen on the product page -
Advanced Pivot Table Data Crunching